JNPA Traffic Dept. - Performance Report for the month of Mar-2025 & FY 2024-25
Total Traffic (In Million Tonnes):
|
Commodities
|
Mar-25
|
Mar-24
|
% variation (MoM)
|
FY 2024-25 (Upto Mar)
|
FY 2023-24 (Upto Mar)
|
% variation (YoY)
|
| Bulk | 0.68 | 0.62 | 9.67% | 8.15 | 7.69 | 5.92% |
| Container | 7.58 | 7.15 | 6.14% | 83.97 | 78.13 | 7.48% |
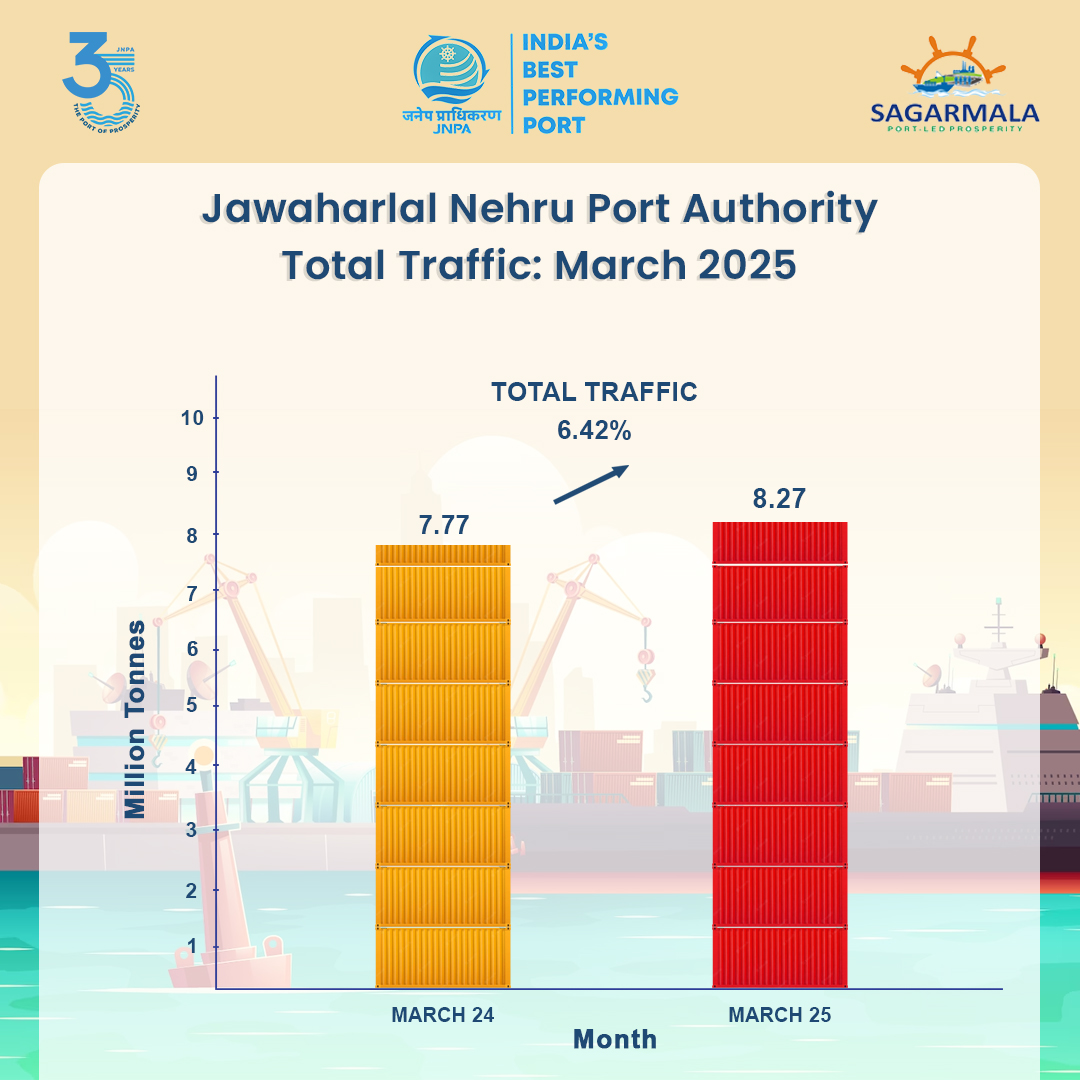
| Total | 8.27 | 7.77 | 6.42% | 92.11 | 85.82 | 7.34% |
Container Traffic (In TEUs):
|
Terminals
|
Mar-25
|
Mar-24
|
% variation (MoM)
|
FY 2024-25 (Upto Mar)
|
FY 2023-24 (Upto Mar)
|
% variation (YoY)
|
| NSDT | 3,758 | 1,307 | 187.53% | 20,445 | 7,948 | 157.23% |
| NSFT | 60,204 | 58,119 | 3.59% | 594,260 | 562,154 | 5.71% |
| NSICT | 106,576 | 99,411 | 7.21% | 1,207,729 | 1,132,238 | 6.67% |
| NSIGT | 96,003 | 96,095 | -0.10% | 1,129,933 | 1,111,838 | 1.63% |
| APMT | 183,525 | 172,091 | 6.64% | 2,078,961 | 1,588,485 | 30.88% |
| BMCT | 222,201 | 167,770 | 32.44% | 2,270,181 | 2,027,781 | 11.95% |
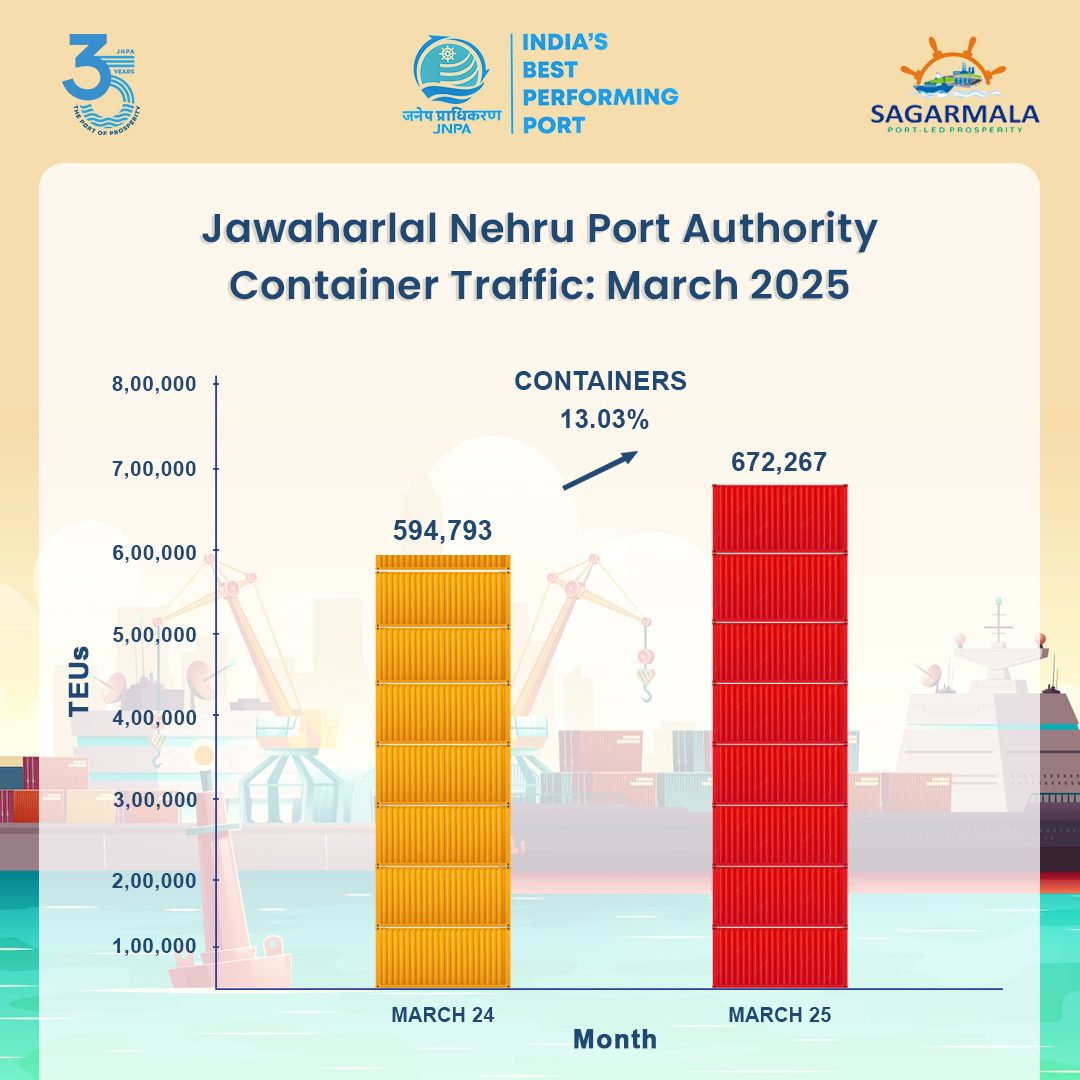
| TOTAL | 672,267 | 594,793 | 13.03% | 7,301,509 | 6,430,444 | 13.55% |
Rakes:
|
Particulars
|
Mar-25
|
Mar-24
|
% variation (MoM)
|
FY 2024-25 (Upto Mar)
|
FY 2023-24 (Upto Mar)
|
% variation (YoY)
|
| No. of Rakes | 629 | 553 | 13.74% | 6,793 | 6,417 | 5.86% |
| Containers (TEUs) | 99,929 | 86,630 | 15.35% | 1,078,315 | 1,022,133 | 5.50% |
Highlights of March-2025:
- JNPA handled 672,267 TEUs of containers & 8.27 Million Tonnes of total cargo in Mar-2025 which is higher by 13.03% & 6.42% respectively as compared to traffic in Mar-2024.
- JNPA has achieved the highest ever monthly Container throughput of 672,267 TEUs in Mar’2025 by surpassing the previous highest of 639,333 TEUs handled in Aug’2024.
- JNPA handled 629 container rakes and 99,929 TEUs during Mar-2025, as compared to 553 rakes and 86,630 TEUs in Mar-2024.
- BMCT has recorded the highest monthly throughput of 2,22,201 TEUs ever handled by any terminal at JNPA.
Highlights of FY 2024-2025:
- JNPA handled 7,301,509 TEUs of containers & 92.12 Million Tonnes of total cargo from Apr-2024 to Mar-2025 which is higher by 13.55 % & 7.34 % respectively as compared to the corresponding period in a previous financial year. This is the highest yearly throughput handled at JNPA in a Financial year.
- BMCT has recorded the highest yearly throughput of 22,70,181 TEUs ever handled by any terminal at JNPA.
- In FY 2024-25, BMCT, APMT & NSFT have recorded their individual highest yearly throughput.
- NSDT has recorded the highest yearly handling of 18,02,117 tonnes of Cement & 4,51,242 tonnes of Steel at JNPA.
- JNPA handled 6,793 container rakes and 1,078,315 TEUs as compared to 6,417 rakes and 1,022,133 TEUs during the corresponding period in the previous financial year.
- The highest rail volume of 1,078,315 TEUs handled at JNPA in FY 2024-25 surpasses the previous volume of 10,76,152 TEUs handled in FY 2009-10.